|
Chapter 9 Extract: … |
|||
|
⁞  |
|||
 |
 |
||
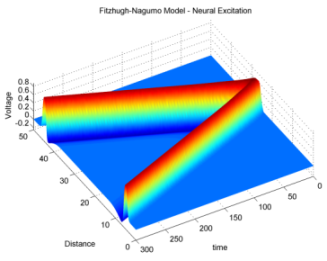
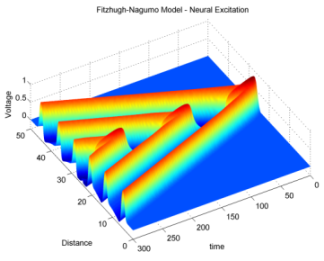
| FIGURE 9.7a: 3D plot of neural excitation resulting from a single pulse stimulus applied at x = 25 (normalized units). | FIGURE 9.9a: 3D plot of neural excitation resulting from a continuous pulse stimulus applied at x = 25 (normalized units). | ||
|
video … (2.2MB)
|
video
… (2.7MB)
|
||
 |
Traveling Wave Analysis of Partial Differential Equations
Numerical and Analytical Methods with Matlab and
Maple
Graham W Griffiths • William E Schiesser
(Academic Press, ISBN: 978-0-12-384652-5) |